Methodology
Step-by-step Guide
Click here to view the full step-by-step guide. Continue scrolling to see an abridged version.
Consideration: Iso - Area vs Buffer
A buffer area is the most common way to delineate a catchment area. It measures a Euclidean distance away from the point given. However, this convenience comes with some issue. Using Euclidean distances is essentially a straight line and can be misleading and impractical on a map.
A more credible and realistic approach to delineate the catchment area would be to use network distance i.e., the shortest distance approach. The method that provides this approach is Iso-Areas as Polygons (from Layer). The iso areas are mapped onto the walkable paths by Singaporeans making it more accurate.
In reality, a person cannot always travel in a straight line towards their destination but will have to turn at bends and curves depending on their walking paths.
1.0 Data Collection
1.1 Downloading geospatial data
First, download the following geospatial data from data.gov.sg:
Master Plan 2019 Subzone Boundary (No Sea)
Rail stations
Next, download geospatial data from geofabrick:
- Roads and Buildings data from OpenStreetMap(OSM) data sets
2.0 Data Preparation, Data Cleaning and QGIS
2.1 Preparation of Road Network Layer
We imported the Road Network data(gis_osm_roads_free_1.shp) into QGIS. The Road Network data contains the Road network from Malaysia, Brunei and Singapore.
2.1.1 Selecting all road network within the study area
Using the Select Features by Polygon operation of QGIS, we then extracted the road network features that fall within Singapore study area.
2.1.2 Extracting roads except expressways
Under the Layers panel, right click on roads –> Open Attribute Table.
Click on Select features using an expression icon. The Select by Expression dialog window will appear. Under the expression pane, we keyed in the following to select expressways in Singapore:
“fclass”= ’motorway or “fclass”= ’motorway_link
In the attribute table, we then clicked on Invert Selection so that all the roads except expressways are selected. The selection was then saved.
2.2 Preparation of Buildings Layer
Import the Building Network data(gis_osm_buildings_free_1.shp) into QGIS. The building Network data contains the building network from Malaysia, Brunei and Singapore.
2.2.1 Selecting all buildings within the study area
Using the Clip operation of QGIS, extract the building network features that fall with Singapore study area.
For the Input layer, we selected the input layer to clip i.e. gis_osm_roads_buildings_1.shp
For the Overlay layer, we selected the layer that will be used as reference i.e. SG_Subzone
After clipping, we saved the new clip as Buildings.
2.2.2 Categorising buildings within the iso areas
Upon inspecting the attribute table of the buildings layer, we found that some of the buildings were not categorised properly i.e. Null values.
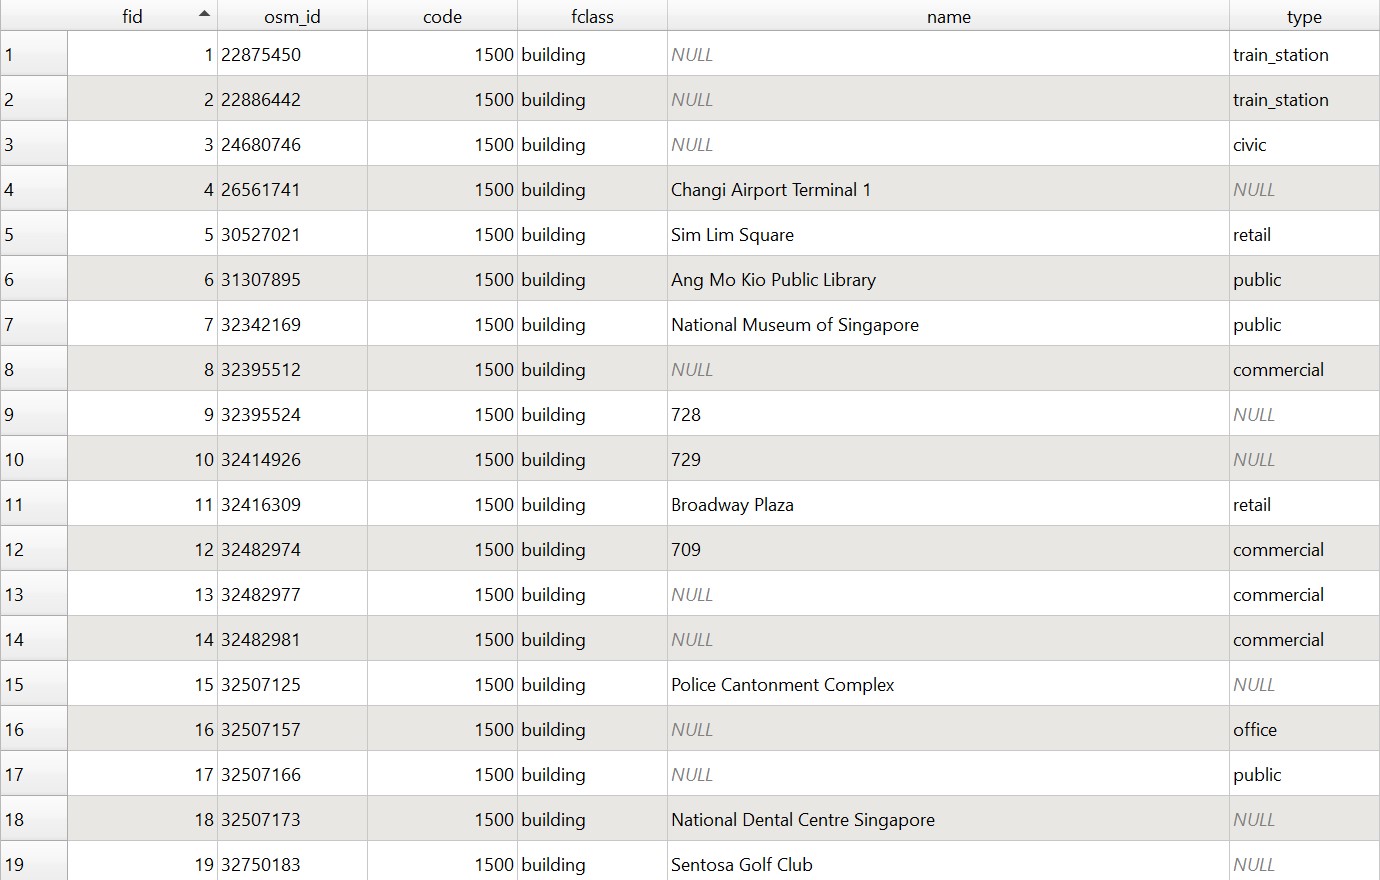
Thus, we used Google street View as a reference and re-categorised these buildings.
2.2.2.1 Creating a new field called class for the buildings within the iso area
From the attribute table, we clicked on the toggle editing mode to create a New field
For Name, type ‘class’
For Type, select Text (string)
For Length, select 30
Click OK
2.2.2.2 Identifying buildings within the iso-areas
Import OpenStreetMap layer into QGIS.
Using Google Street view as a reference, we can compare and determine what class each building should be.
2.2.2.3 Categorising the buildings within the Iso Area
Select the buildings to be classed and open the attribute table. Select the Open field calculator symbol and check Update existing field Click on the dropdown arrow and select class, then in the Expression Pane, type the correct class. The classifications we have decided on are:
Private Residential
Business
Civic
Education
Others
Public Residential
Religious
This will update all selected features to the correct class.
2.2.2.4 Symbolising Buildings
a) Right click on FM_buildings Layer.
b) Click on Properties
c) Go to the Symbology tab
d) Select Categorized
e) For value, select class
f) Click on Apply
g) Click on the dropdown arrow of Symbol and change the colour schemes, assign the values of the class to the following colours below

h) Click on Apply again then click on OK
Repeat the steps on the remaining buildings that falls within the other iso areas.
2.3 Preparation of Rail Stations
Import Rail Stations data(master-plan-2019-rail-station-layer) into QGIS. The rail stations data contains the all the MRT station in Singapore.
2.3.1 Extracting TEL Stage 4 stations
Under the Layers panel, right click on G_MP19_RAIL_STN_PL –> Open Attribute Table.
Click on Select features using an expression and key in the following query statement:
“Name” = ‘FOUNDERS’’ MEMORIAL’ or “Name” = ‘TANJONG RHU’ or “Name” = ‘KATONG PARK’ or “Name” = ‘TANJONG KATONG’ or “Name” = ‘MARINE PARADE’ or “Name” = ‘MARINE TERRACE’ or “Name” = ‘SIGLAP’ or “Name” = ‘BAYSHORE’
Click on Select Features and then close the window. Save the selected features as TEL4_stations.
2.3.2 Adding Entrances/Exits to the TEL stage 4 stations
2.3.2.1 Creating a new entrance/exit layer
We need to create a point layer for MRT station entrances in order to have an end point for network creation later.
a) Go to Layer –> Create Layer –>New Shapefile Layer
b) For file name, navigate to the Geopackage folder and name the layer MRT Station Entrance Stage 4.
c) For Geometry type, select Point from the dropdown arrow.
d) Change the CRS projection system back to EPSG 3412.
Two new fields should be added, STN_N and EXIT_N.
a) To add a new field, type STN_N.
b) For Type, select text
c) Click on Add to Fields List
A new row will be added.
Using the same steps, add a new row where Name= EXIT_N and Type= integer
Click on OK
2.3.2.2 Adding points to TEL Stage 4 MRT stations
a) Click on the toggle editing mode
b) Click on the Add Point Feature
c) Using the station picture in Figure 1 of Founders’ Memorial in LTA website as a reference, manually click on the Founders memorial polygon to add the points.
d) A dialog window will appear.
e) For id, type 1. For STN_N, type FOUNDERS’ MEMORIAL. For EXIT_N , type 1.
f) For the second exit, for id, type 2. For STN_N, type FOUNDERS’ MEMORIAL. For EXIT_N , type 2.
g) Click on the toggle editing mode.
d) Click save.
Repeat the same steps for the entrances/exits of the other MRT stations. Use the TEL stage 4 entrance/exits in the LTA website as a reference.
Note: The id is the nth MRT entrances/exits of all where n>0. The EXIT_N represents the kth entrance/exit of that MRT station where K>0.
We saved the layer in Geopackage format. Call the layer MRT Station Entrance Stage 4.
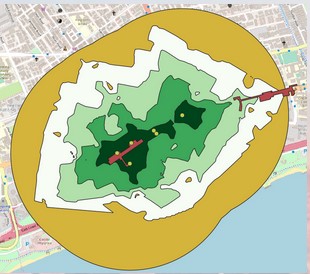
2.4 Preparation of ISO-AREAS of 800m with contour lines of 200m
Now we will be implementing Iso-Area as Polygons (from Layer) as a way to delineate the catchment areas to derive the accessibility to the TEL Stage 4 MRT stations
2.4.1 Creating ISO AREAS
Select the entrance/exit points of a single MRT station (eg. FOUNDERS’ MEMORIAL)
In the menu bar, go to Processing –> toolbox.
In toolbox, click on the dropdown arrow beside QNEAT3
Click on the dropdown arrow beside Iso-Areas.
Double click on Iso-Area as Polygons (from Layer)
The dialog window for Iso-Area as Polygons (from Layer) will appear
For Vector layer representing network, select roads except motorway from the drop-down list.
For Start Points, select MRT Station Entrance Stage 4 from the drop-down list
For Unique Point ID field, leave it as fid
For Size of Iso-Area (distance or time value), type 800.
For Contour Interval, type 200
Keep the rest of the entries as default.
When you are ready to run the function, click on run
When the process completed, two temporary layers namely: Output Polygon and Output Interpolation will be added onto Layers panel and display on QGIS View window. Save the layer as {Station initials}_ISO.
2.4.2 Changing the interval size of the iso-areas
a) Right click on FM_ISO Layer.
b) Click on Properties
c) Go to the Symbology tab
d) Select Graduated
e) For value, select cost_level
f) Change the colour ramp to a suitable colour range and check Invert colour ramp
g) For mode select Fixed Interval
h) Change the interval size to 199. This is to ensure each band shows up in the gradient
i) Once ready, click on Apply then OK
Click on Save then click on the Deselect Features from All Layers
Repeat the steps to create the iso areas for the remaining entrances/exits of the other MRT stations and change the intervals.
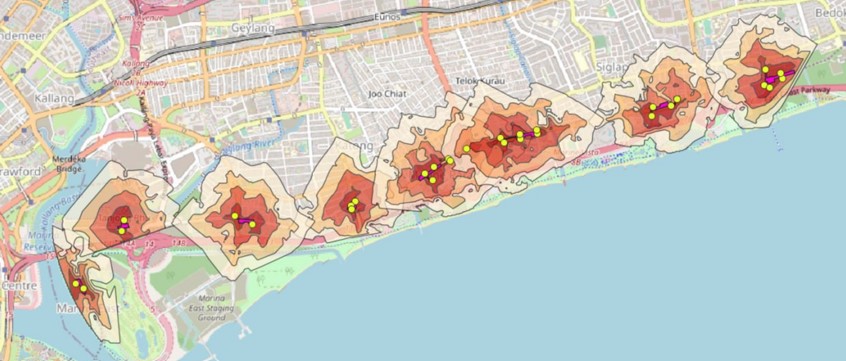
2.5 Extracting buildings within the iso areas
Do not use clipped as the buildings may get ‘chopped’ off
From the menu bar, select the Select by Location
For Select features from, select TEL- buildings from the dropdown arrow
Check the intersect box
For By comparing to the features from, select FM_ISO from the dropdown arrow
After running it, save the layer as {Station initials}_buildings.
Repeat the process for all stations.
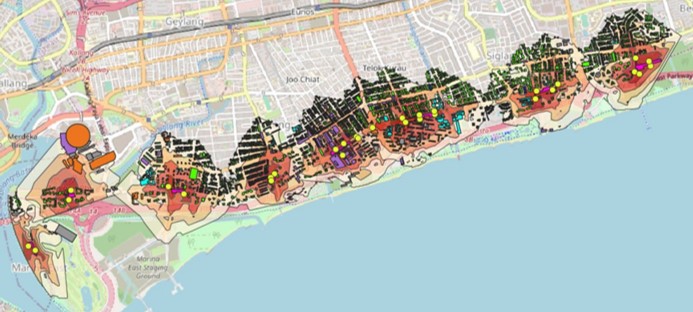
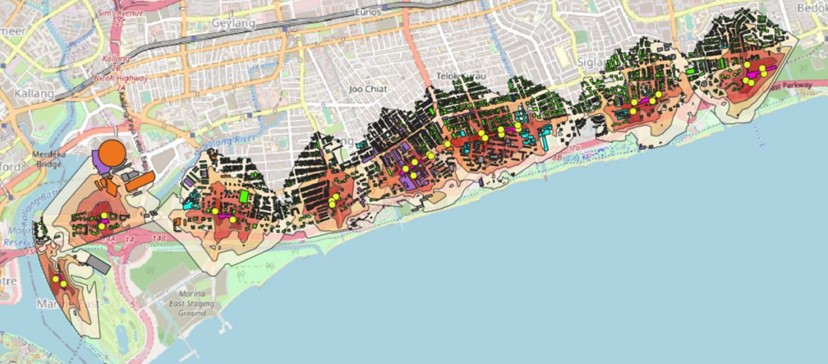
Final Map and Geoweb
This will be what the final map looks like. View the geoweb version here.